Monitor Nextcloud server with Prometheus and Grafana
In our previous post, we have talked about how to set up Grafana and Prometheus in an Alpine LXC. To make them actually useful, we need feed them some real-world data. Here I will use them to monitor the status of my self-hosted Nextcloud.
Set up the exporters
Prometheus can only reads data sources that it understands. To put it in another
way, if a data source is not specifically designed from Prometheus, it needs to
be processed by an “exporter”, then Prometheus can import the data. As a result,
we need to set up two exporters. One is called node_exporter that sends the
status of the host machine, and the other is nextcloud-exporter that reads
Nextcloud’s json API and convert it to Prometheus’ format.
In principle, nextcloud-exporter can be run from anywhere that can access the
Nextcloud server, but the node_exporter has to be run from the host of
Nextcloud. For simplicity, we will run both exporters on the host of Nextcloud.
For my case, the Nextcloud is running inside a Debian LXC, so the services are
managed by systemd.
node_exporter
The pre-compiled binary file of the node_exporter can be directly downloaded
from its GitHub release page. Just find the one that matches
your architecture, download the tarball, extract it, and copy the executable to
a location in your PATH. Personally, I copied it to /usr/local/bin.
Now, if you run node_exporter directly, you should be able to see some
information printed out. Head over to your browser, you should be able to see
some numbers at http://nextcloud_ip:9100/metrics. of course, you can also use
wget or curl to test this. This means node_exporter is running ok.
Next, we will set it up as a service.
-
Create a user and group to run
node_exporter.groupadd node_exporter useradd -g node_exporter --no-create-home --shell /bin/false node_exporter mkdir /etc/node_exporter chown node_exporter:node_exporter /etc/node_exporterThe configuration file of
node_exporterwill sit in the folder/etc/node_exporter, but at this moment, we will leave it at default. In the future, you can use a configuration file to apply some control on what numbers will be exported. -
Create a file
/etc/systemd/system/node_exporter.serviceand paste the following content to it[Unit] Description=Node Exporter Documentation=https://prometheus.io/docs/guides/node-exporter/ Wants=network-online.target After=network-online.target [Service] Type=simple User=node_exporter Group=node_exporter Restart=always ExecStart=/usr/local/bin/node_exporter [Install] WantedBy=multi-user.targetThe file is pretty simple. We just want this service to start after the system is online. After all, without Internet (at least LAN), where do you send the data to?
-
You should be able to run the service without an error
systemctl daemon-reload
systemctl start node_exporter
systemctl status node_exporter
Everything should look right. If so, add this service to startup via
systemctl enable node_exporter.
Now we are done with node_exporter. Let us do the same thing for
nextcloud-exporter.
nextcloud-exporter
For the package to access Nextcloud’s serverinfo API, authentication is
required. In this case, using a token will be preferred. To set up a token, you
can follow the package’s README.
Next, we need to compile the package
git clone https://github.com/xperimental/nextcloud-exporter.git
cd nextcloud-exporter
make
The package is written in Go, so you need set it up. Follow the official instruction here. Just note that the package uses a feature that was added in version 1.21, so make sure you install a Go version 1.21+.
You will also need make and git. Both can be installed from the system’s
package manager. If just download the zip of the repo, git is not necessary.
After the compilation is done, you can run the command via
nextcloud-exporter -s nextcloud_ip --auth-token your_token
This time, you should see the exported numbers at
http://nextcloud_ip:9205/metrics. Similar to what we have done previously, we
will add `nextcloud-exporter into services.
-
Create a user and group.
groupadd nextcloud_exporter useradd -g nextcloud_exporter --no-create-home --shell /bin/false node_exporter -
Create a file
/etc/systemd/system/nextcloud-exporter.serviceand paste the following content to it[Unit] Description=Nextcloud Exporter Documentation=https://github.com/xperimental/nextcloud-exporter Wants=network-online.target nginx.service php8.2-fpm.service After=network-online.target nginx.service php8.2-fpm.service [Service] Type=simple User=nextcloud_exporter Group=nextcloud_exporter Restart=always ExecStart=/usr/local/bin/nextcloud-exporter \ -s nextcloud_ip --auth-token=your_token [Install] WantedBy=multi-user.targetApart from the “online” target, I listed nginx and php-fpm as additional dependencies, as Nextcloud will not run without these two services. However, it is really not required at all in the systemd file.
-
If the service runs at it should, we can enable it and add it to startup.
systemctl daemon-reload
systemctl start node_exporter
systemctl enable node_exporter
Prometheus
Next, we will add both exporters to Prometheus. Head to your Prometheus server
and modify the configuration file /etc/prometheus/prometheus.yml.
At the end of file, add the following section
  - job_name: "nextcloud"

    static_configs:
      - targets: ["nextcloud_ip:9205"]
      - targets: ["nextcloud_ip:9100"]
to add both exporter to Prometheus. Note that if you have assigned a different port for either exporter, make sure it matches here.
After you restart your Prometheus service, you should be able to see the new
dataset listed as nextcloud.
Add the dashboard to Grafana
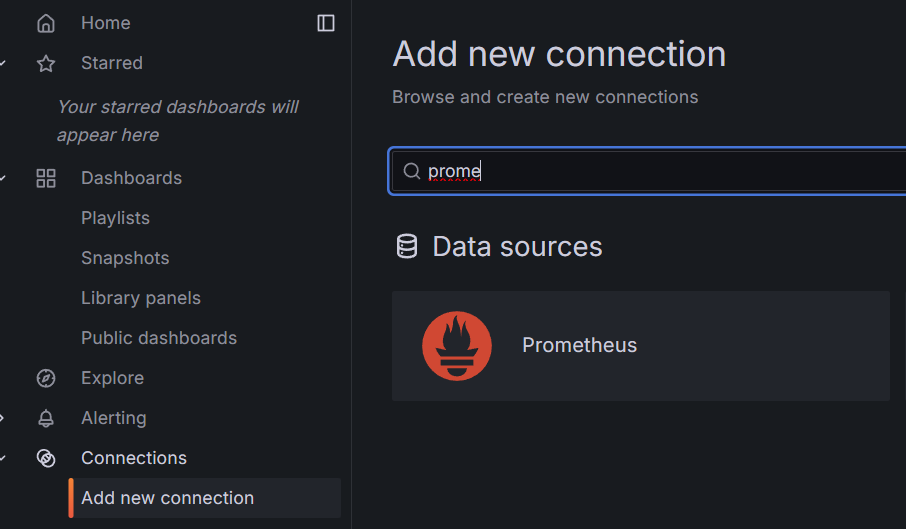
Now we head to grafana. Add a new data source of our Prometheus server.
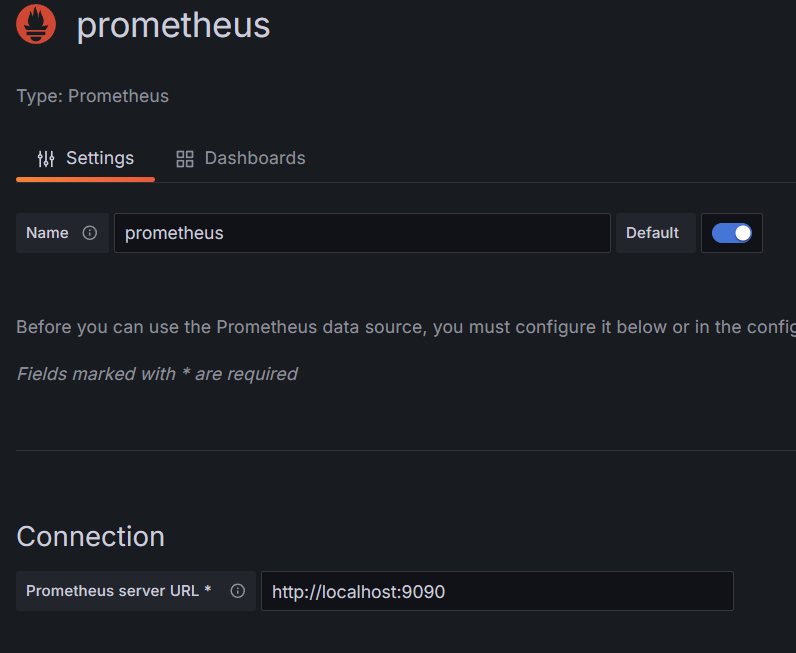
Then just give a name and URL to your Prometheus. For my case, it is simply
http://localhost:9090.
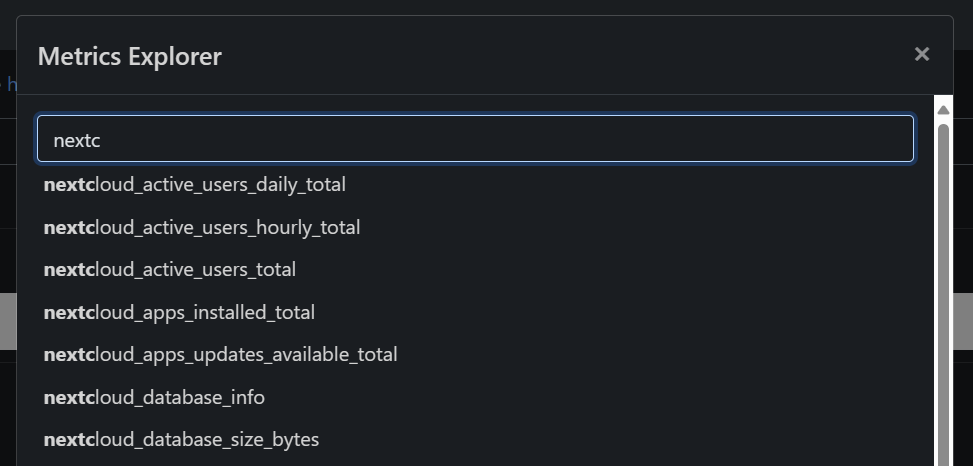
Next, we can build a dashboard from the data. To save us some efforts, I will directly import the existing dashboard from ncp-monitoring-dashboard. The json file to the dashboard is here. The content of the json file is pasted below. It is so lengthy that I have to make it scrollable.
{
"annotations": {
"list": [
{
"builtIn": 1,
"datasource": {
"type": "datasource",
"uid": "grafana"
},
"enable": true,
"hide": true,
"iconColor": "rgba(0, 211, 255, 1)",
"name": "Annotations & Alerts",
"target": {
"limit": 100,
"matchAny": false,
"tags": [],
"type": "dashboard"
},
"type": "dashboard"
}
]
},
"editable": true,
"fiscalYearStartMonth": 0,
"graphTooltip": 0,
"id": 1,
"iteration": 1649428020610,
"links": [],
"liveNow": false,
"panels": [
{
"collapsed": false,
"datasource": {
"type": "datasource",
"uid": "grafana"
},
"gridPos": {
"h": 1,
"w": 24,
"x": 0,
"y": 0
},
"id": 2,
"panels": [],
"title": "Overview",
"type": "row"
},
{
"datasource": {
"type": "prometheus",
"uid": "P3791F55F620A72A5"
},
"fieldConfig": {
"defaults": {
"color": {
"mode": "palette-classic"
},
"custom": {
"axisLabel": "",
"axisPlacement": "auto",
"barAlignment": 0,
"drawStyle": "line",
"fillOpacity": 20,
"gradientMode": "none",
"hideFrom": {
"legend": false,
"tooltip": false,
"viz": false
},
"lineInterpolation": "linear",
"lineWidth": 1,
"pointSize": 2,
"scaleDistribution": {
"type": "linear"
},
"showPoints": "auto",
"spanNulls": false,
"stacking": {
"group": "A",
"mode": "none"
},
"thresholdsStyle": {
"mode": "off"
}
},
"mappings": [],
"max": 1,
"min": 0,
"thresholds": {
"mode": "absolute",
"steps": [
{
"color": "green",
"value": null
},
{
"color": "red",
"value": 80
}
]
}
},
"overrides": []
},
"gridPos": {
"h": 5,
"w": 7,
"x": 0,
"y": 1
},
"id": 4,
"options": {
"legend": {
"calcs": [],
"displayMode": "list",
"placement": "bottom"
},
"tooltip": {
"mode": "single",
"sort": "none"
}
},
"targets": [
{
"exemplar": true,
"expr": "nextcloud_up",
"interval": "",
"legendFormat": "",
"queryType": "randomWalk",
"refId": "A"
}
],
"title": "Nextcloud Availability",
"type": "timeseries"
},
{
"datasource": {
"type": "prometheus",
"uid": "P3791F55F620A72A5"
},
"fieldConfig": {
"defaults": {
"color": {
"mode": "palette-classic"
},
"custom": {
"axisLabel": "",
"axisPlacement": "auto",
"barAlignment": 0,
"drawStyle": "line",
"fillOpacity": 20,
"gradientMode": "none",
"hideFrom": {
"legend": false,
"tooltip": false,
"viz": false
},
"lineInterpolation": "linear",
"lineWidth": 1,
"pointSize": 2,
"scaleDistribution": {
"type": "linear"
},
"showPoints": "auto",
"spanNulls": false,
"stacking": {
"group": "A",
"mode": "none"
},
"thresholdsStyle": {
"mode": "off"
}
},
"mappings": [],
"thresholds": {
"mode": "absolute",
"steps": [
{
"color": "green",
"value": null
},
{
"color": "red",
"value": 80
}
]
}
},
"overrides": []
},
"gridPos": {
"h": 5,
"w": 5,
"x": 7,
"y": 1
},
"id": 6,
"options": {
"legend": {
"calcs": [],
"displayMode": "list",
"placement": "bottom"
},
"tooltip": {
"mode": "single",
"sort": "none"
}
},
"targets": [
{
"exemplar": true,
"expr": "nextcloud_shares_federated_total",
"interval": "",
"legendFormat": "",
"queryType": "randomWalk",
"refId": "A"
}
],
"title": "Federated Nextcloud Data Exchange Total",
"type": "timeseries"
},
{
"datasource": {
"type": "prometheus",
"uid": "P3791F55F620A72A5"
},
"fieldConfig": {
"defaults": {
"color": {
"mode": "fixed"
},
"mappings": [],
"thresholds": {
"mode": "absolute",
"steps": [
{
"color": "green",
"value": null
}
]
}
},
"overrides": []
},
"gridPos": {
"h": 3,
"w": 2,
"x": 12,
"y": 1
},
"id": 10,
"options": {
"colorMode": "value",
"graphMode": "none",
"justifyMode": "auto",
"orientation": "auto",
"reduceOptions": {
"calcs": [
"lastNotNull"
],
"fields": "/^version$/",
"values": false
},
"text": {},
"textMode": "value"
},
"pluginVersion": "v1.0",
"targets": [
{
"exemplar": true,
"expr": "nextcloud_system_info",
"format": "table",
"instant": false,
"interval": "",
"legendFormat": "",
"queryType": "randomWalk",
"refId": "A"
}
],
"title": "NC Version",
"type": "stat"
},
{
"datasource": {
"type": "prometheus",
"uid": "P3791F55F620A72A5"
},
"fieldConfig": {
"defaults": {
"color": {
"mode": "fixed"
},
"mappings": [],
"thresholds": {
"mode": "absolute",
"steps": [
{
"color": "green",
"value": null
}
]
},
"unit": "bytes"
},
"overrides": []
},
"gridPos": {
"h": 3,
"w": 3,
"x": 14,
"y": 1
},
"id": 12,
"options": {
"colorMode": "value",
"graphMode": "none",
"justifyMode": "auto",
"orientation": "auto",
"reduceOptions": {
"calcs": [
"lastNotNull"
],
"fields": "",
"values": false
},
"text": {},
"textMode": "auto"
},
"pluginVersion": "v1.0",
"targets": [
{
"exemplar": true,
"expr": "nextcloud_php_upload_max_size_bytes",
"interval": "",
"legendFormat": "",
"queryType": "randomWalk",
"refId": "A"
}
],
"title": "PHP Max Upload File Size",
"type": "stat"
},
{
"datasource": {
"type": "prometheus",
"uid": "P3791F55F620A72A5"
},
"fieldConfig": {
"defaults": {
"color": {
"mode": "fixed"
},
"mappings": [],
"thresholds": {
"mode": "absolute",
"steps": [
{
"color": "green",
"value": null
}
]
},
"unit": "decbytes"
},
"overrides": []
},
"gridPos": {
"h": 3,
"w": 3,
"x": 17,
"y": 1
},
"id": 14,
"options": {
"colorMode": "value",
"graphMode": "none",
"justifyMode": "auto",
"orientation": "auto",
"reduceOptions": {
"calcs": [
"lastNotNull"
],
"fields": "",
"values": false
},
"text": {},
"textMode": "auto"
},
"pluginVersion": "v1.0",
"targets": [
{
"exemplar": true,
"expr": "nextcloud_php_memory_limit_bytes",
"interval": "",
"legendFormat": "",
"queryType": "randomWalk",
"refId": "A"
}
],
"title": "PHP Max Memory Size",
"type": "stat"
},
{
"datasource": {
"type": "prometheus",
"uid": "P3791F55F620A72A5"
},
"fieldConfig": {
"defaults": {
"color": {
"mode": "fixed"
},
"mappings": [],
"thresholds": {
"mode": "absolute",
"steps": [
{
"color": "green",
"value": null
}
]
}
},
"overrides": []
},
"gridPos": {
"h": 3,
"w": 4,
"x": 20,
"y": 1
},
"id": 22,
"options": {
"colorMode": "value",
"graphMode": "area",
"justifyMode": "auto",
"orientation": "auto",
"reduceOptions": {
"calcs": [
"lastNotNull"
],
"fields": "",
"values": false
},
"text": {},
"textMode": "auto"
},
"pluginVersion": "v1.0",
"targets": [
{
"exemplar": true,
"expr": "nextcloud_files_total",
"interval": "",
"legendFormat": "",
"queryType": "randomWalk",
"refId": "A"
}
],
"title": "Total File Count",
"type": "stat"
},
{
"datasource": {
"type": "prometheus",
"uid": "P3791F55F620A72A5"
},
"fieldConfig": {
"defaults": {
"color": {
"mode": "thresholds"
},
"mappings": [],
"max": 0,
"min": -2147484000000,
"thresholds": {
"mode": "absolute",
"steps": [
{
"color": "green",
"value": null
},
{
"color": "#EAB839",
"value": -214748400000
},
{
"color": "red",
"value": -53687090000
}
]
},
"unit": "bytes"
},
"overrides": []
},
"gridPos": {
"h": 4,
"w": 3,
"x": 12,
"y": 4
},
"id": 16,
"options": {
"orientation": "auto",
"reduceOptions": {
"calcs": [
"lastNotNull"
],
"fields": "",
"values": false
},
"showThresholdLabels": false,
"showThresholdMarkers": true,
"text": {}
},
"pluginVersion": "v1.0",
"targets": [
{
"exemplar": true,
"expr": "-nextcloud_free_space_bytes",
"instant": true,
"interval": "",
"legendFormat": "",
"queryType": "randomWalk",
"refId": "A"
}
],
"title": "Free Space Remaining",
"type": "gauge"
},
{
"datasource": {
"type": "prometheus",
"uid": "P3791F55F620A72A5"
},
"fieldConfig": {
"defaults": {
"color": {
"mode": "palette-classic"
},
"custom": {
"hideFrom": {
"legend": false,
"tooltip": false,
"viz": false
}
},
"mappings": []
},
"overrides": []
},
"gridPos": {
"h": 9,
"w": 5,
"x": 15,
"y": 4
},
"id": 20,
"options": {
"displayLabels": [
"value"
],
"legend": {
"displayMode": "list",
"placement": "bottom",
"values": [
"percent"
]
},
"pieType": "pie",
"reduceOptions": {
"calcs": [
"lastNotNull"
],
"fields": "",
"values": false
},
"tooltip": {
"mode": "single",
"sort": "none"
}
},
"targets": [
{
"exemplar": true,
"expr": "nextcloud_shares_total",
"instant": false,
"interval": "",
"legendFormat": "",
"queryType": "randomWalk",
"refId": "A"
}
],
"title": "Total Shared Links by Type",
"transformations": [
{
"id": "renameByRegex",
"options": {
"regex": "^link",
"renamePattern": "public link"
}
},
{
"id": "renameByRegex",
"options": {
"regex": "authlink",
"renamePattern": "pw protected link"
}
},
{
"id": "renameByRegex",
"options": {
"regex": "user",
"renamePattern": "user share"
}
}
],
"type": "piechart"
},
{
"datasource": {
"type": "prometheus",
"uid": "P3791F55F620A72A5"
},
"fieldConfig": {
"defaults": {
"color": {
"mode": "fixed"
},
"mappings": [],
"thresholds": {
"mode": "absolute",
"steps": [
{
"color": "green",
"value": null
},
{
"color": "red",
"value": 80
}
]
}
},
"overrides": []
},
"gridPos": {
"h": 3,
"w": 4,
"x": 20,
"y": 4
},
"id": 24,
"options": {
"colorMode": "value",
"graphMode": "area",
"justifyMode": "auto",
"orientation": "auto",
"reduceOptions": {
"calcs": [
"lastNotNull"
],
"fields": "",
"values": false
},
"text": {},
"textMode": "auto"
},
"pluginVersion": "v1.0",
"targets": [
{
"exemplar": true,
"expr": "nextcloud_apps_installed_total",
"interval": "",
"legendFormat": "",
"queryType": "randomWalk",
"refId": "A"
}
],
"title": "NC Apps Installed",
"type": "stat"
},
{
"datasource": {
"type": "prometheus",
"uid": "P3791F55F620A72A5"
},
"description": "",
"fieldConfig": {
"defaults": {
"color": {
"mode": "palette-classic"
},
"custom": {
"axisLabel": "",
"axisPlacement": "auto",
"barAlignment": 0,
"drawStyle": "line",
"fillOpacity": 0,
"gradientMode": "none",
"hideFrom": {
"legend": false,
"tooltip": false,
"viz": false
},
"lineInterpolation": "linear",
"lineWidth": 1,
"pointSize": 2,
"scaleDistribution": {
"type": "linear"
},
"showPoints": "auto",
"spanNulls": false,
"stacking": {
"group": "A",
"mode": "none"
},
"thresholdsStyle": {
"mode": "line"
}
},
"mappings": [],
"max": 100,
"min": 0,
"thresholds": {
"mode": "absolute",
"steps": [
{
"color": "green",
"value": null
},
{
"color": "red",
"value": 80
}
]
},
"unit": "percent"
},
"overrides": [
{
"matcher": {
"id": "byName",
"options": "total"
},
"properties": [
{
"id": "custom.fillOpacity",
"value": 30
}
]
}
]
},
"gridPos": {
"h": 7,
"w": 12,
"x": 0,
"y": 6
},
"id": 8,
"options": {
"legend": {
"calcs": [],
"displayMode": "table",
"placement": "right"
},
"tooltip": {
"mode": "single",
"sort": "none"
}
},
"targets": [
{
"exemplar": true,
"expr": "100 - (rate(node_cpu_seconds_total{mode=\"idle\"}[1m]) * 100)",
"interval": "",
"legendFormat": "CPU ",
"queryType": "randomWalk",
"refId": "A"
},
{
"exemplar": true,
"expr": "100 - (avg (rate(node_cpu_seconds_total{mode=\"idle\"}[1m])) * 100)",
"hide": false,
"interval": "",
"legendFormat": "total",
"refId": "B"
}
],
"title": "CPU Load",
"type": "timeseries"
},
{
"datasource": {
"type": "prometheus",
"uid": "P3791F55F620A72A5"
},
"fieldConfig": {
"defaults": {
"color": {
"mode": "thresholds"
},
"mappings": [],
"thresholds": {
"mode": "absolute",
"steps": [
{
"color": "green",
"value": null
},
{
"color": "red",
"value": 80
}
]
}
},
"overrides": []
},
"gridPos": {
"h": 3,
"w": 4,
"x": 20,
"y": 7
},
"id": 28,
"options": {
"colorMode": "value",
"graphMode": "area",
"justifyMode": "auto",
"orientation": "auto",
"reduceOptions": {
"calcs": [
"lastNotNull"
],
"fields": "",
"values": false
},
"text": {},
"textMode": "auto"
},
"pluginVersion": "v1.0",
"targets": [
{
"exemplar": true,
"expr": "nextcloud_active_users_total",
"interval": "",
"legendFormat": "",
"queryType": "randomWalk",
"refId": "A"
}
],
"title": "Currently Active Users",
"type": "stat"
},
{
"datasource": {
"type": "prometheus",
"uid": "P3791F55F620A72A5"
},
"fieldConfig": {
"defaults": {
"color": {
"mode": "thresholds"
},
"mappings": [],
"min": 0,
"thresholds": {
"mode": "absolute",
"steps": [
{
"color": "green",
"value": null
}
]
},
"unit": "bytes"
},
"overrides": []
},
"gridPos": {
"h": 5,
"w": 3,
"x": 12,
"y": 8
},
"id": 18,
"options": {
"colorMode": "value",
"graphMode": "area",
"justifyMode": "auto",
"orientation": "auto",
"reduceOptions": {
"calcs": [
"lastNotNull"
],
"fields": "",
"values": false
},
"text": {},
"textMode": "auto"
},
"pluginVersion": "v1.0",
"targets": [
{
"exemplar": true,
"expr": "nextcloud_database_size_bytes",
"instant": false,
"interval": "",
"legendFormat": "",
"queryType": "randomWalk",
"refId": "A"
}
],
"title": "Database Size",
"type": "stat"
},
{
"datasource": {
"type": "prometheus",
"uid": "P3791F55F620A72A5"
},
"fieldConfig": {
"defaults": {
"color": {
"mode": "thresholds"
},
"mappings": [],
"thresholds": {
"mode": "absolute",
"steps": [
{
"color": "green",
"value": null
},
{
"color": "red",
"value": 1
}
]
}
},
"overrides": []
},
"gridPos": {
"h": 3,
"w": 4,
"x": 20,
"y": 10
},
"id": 26,
"options": {
"colorMode": "value",
"graphMode": "area",
"justifyMode": "auto",
"orientation": "auto",
"reduceOptions": {
"calcs": [
"lastNotNull"
],
"fields": "",
"values": false
},
"text": {},
"textMode": "auto"
},
"pluginVersion": "v1.0",
"targets": [
{
"exemplar": true,
"expr": "rate(nextcloud_auth_errors_total[1h])",
"interval": "",
"legendFormat": "",
"queryType": "randomWalk",
"refId": "A"
}
],
"title": "Auth Errors",
"type": "stat"
},
{
"aliasColors": {},
"bars": false,
"dashLength": 10,
"dashes": false,
"datasource": {
"type": "prometheus",
"uid": "P3791F55F620A72A5"
},
"fill": 1,
"fillGradient": 0,
"gridPos": {
"h": 8,
"w": 9,
"x": 0,
"y": 13
},
"hiddenSeries": false,
"id": 36,
"legend": {
"avg": false,
"current": false,
"max": false,
"min": false,
"show": true,
"total": false,
"values": false
},
"lines": true,
"linewidth": 1,
"nullPointMode": "null",
"options": {
"alertThreshold": true
},
"percentage": false,
"pluginVersion": "v1.0",
"pointradius": 2,
"points": false,
"renderer": "flot",
"seriesOverrides": [],
"spaceLength": 10,
"stack": false,
"steppedLine": false,
"targets": [
{
"exemplar": true,
"expr": "rate(node_network_transmit_bytes_total{device!~\"(br-|docker).*\"}[1m])",
"interval": "",
"legendFormat": "network egress",
"queryType": "randomWalk",
"refId": "A"
},
{
"exemplar": true,
"expr": "rate(node_network_receive_bytes_total{device!~\"(br-|docker).*\"}[1m])",
"hide": false,
"interval": "",
"legendFormat": "network ingress",
"queryType": "randomWalk",
"refId": "B"
}
],
"thresholds": [],
"timeRegions": [],
"title": "Network Traffic",
"tooltip": {
"shared": true,
"sort": 0,
"value_type": "individual"
},
"type": "graph",
"xaxis": {
"mode": "time",
"show": true,
"values": []
},
"yaxes": [
{
"$$hashKey": "object:37",
"format": "binbps",
"logBase": 1,
"show": true
},
{
"$$hashKey": "object:38",
"format": "binbps",
"logBase": 1,
"show": true
}
],
"yaxis": {
"align": true
}
},
{
"datasource": {
"type": "prometheus",
"uid": "P3791F55F620A72A5"
},
"fieldConfig": {
"defaults": {
"color": {
"mode": "palette-classic"
},
"custom": {
"axisLabel": "",
"axisPlacement": "auto",
"barAlignment": 0,
"drawStyle": "line",
"fillOpacity": 20,
"gradientMode": "none",
"hideFrom": {
"legend": false,
"tooltip": false,
"viz": false
},
"lineInterpolation": "linear",
"lineWidth": 1,
"pointSize": 5,
"scaleDistribution": {
"type": "linear"
},
"showPoints": "never",
"spanNulls": false,
"stacking": {
"group": "A",
"mode": "none"
},
"thresholdsStyle": {
"mode": "off"
}
},
"mappings": [],
"min": 0,
"thresholds": {
"mode": "absolute",
"steps": [
{
"color": "green",
"value": null
}
]
},
"unit": "bytes"
},
"overrides": [
{
"matcher": {
"id": "byName",
"options": "max"
},
"properties": [
{
"id": "custom.lineStyle",
"value": {
"dash": [
10,
10
],
"fill": "dash"
}
},
{
"id": "custom.fillOpacity",
"value": 0
},
{
"id": "color",
"value": {
"fixedColor": "dark-red",
"mode": "fixed"
}
}
]
}
]
},
"gridPos": {
"h": 8,
"w": 15,
"x": 9,
"y": 13
},
"id": 30,
"options": {
"legend": {
"calcs": [
"max",
"last"
],
"displayMode": "table",
"placement": "right"
},
"tooltip": {
"mode": "single",
"sort": "none"
}
},
"targets": [
{
"exemplar": true,
"expr": "node_memory_MemTotal_bytes - node_memory_MemAvailable_bytes",
"interval": "",
"legendFormat": "used",
"queryType": "randomWalk",
"refId": "A"
},
{
"exemplar": true,
"expr": "node_memory_MemTotal_bytes",
"hide": false,
"interval": "",
"legendFormat": "max",
"queryType": "randomWalk",
"refId": "B"
}
],
"title": "Memory Usage",
"type": "timeseries"
},
{
"datasource": {
"type": "prometheus",
"uid": "P3791F55F620A72A5"
},
"description": "",
"fieldConfig": {
"defaults": {
"color": {
"mode": "palette-classic"
},
"custom": {
"axisLabel": "load <-----> bytes",
"axisPlacement": "auto",
"barAlignment": 0,
"drawStyle": "line",
"fillOpacity": 20,
"gradientMode": "none",
"hideFrom": {
"legend": false,
"tooltip": false,
"viz": false
},
"lineInterpolation": "linear",
"lineWidth": 1,
"pointSize": 5,
"scaleDistribution": {
"type": "linear"
},
"showPoints": "auto",
"spanNulls": false,
"stacking": {
"group": "A",
"mode": "none"
},
"thresholdsStyle": {
"mode": "off"
}
},
"mappings": [],
"thresholds": {
"mode": "absolute",
"steps": [
{
"color": "green",
"value": null
},
{
"color": "red",
"value": 80
}
]
}
},
"overrides": [
{
"matcher": {
"id": "byFrameRefID",
"options": "C"
},
"properties": [
{
"id": "unit",
"value": "percentunit"
},
{
"id": "min",
"value": -1
},
{
"id": "max",
"value": 1
}
]
},
{
"matcher": {
"id": "byRegexp",
"options": "/.*(read|write)/"
},
"properties": [
{
"id": "unit",
"value": "binBps"
}
]
},
{
"matcher": {
"id": "byRegexp",
"options": "/.* ghost/"
},
"properties": [
{
"id": "custom.hideFrom",
"value": {
"legend": true,
"tooltip": true,
"viz": false
}
},
{
"id": "custom.lineWidth",
"value": 0
},
{
"id": "custom.showPoints",
"value": "never"
},
{
"id": "custom.fillOpacity",
"value": 0
}
]
}
]
},
"gridPos": {
"h": 8,
"w": 15,
"x": 0,
"y": 21
},
"id": 39,
"options": {
"legend": {
"calcs": [
"max"
],
"displayMode": "table",
"placement": "right"
},
"tooltip": {
"mode": "single",
"sort": "none"
}
},
"targets": [
{
"exemplar": true,
"expr": "rate(node_disk_read_bytes_total{device!~\".*(zram|boot|dm-|mtdblock).*\"}[1m])",
"interval": "",
"legendFormat": " read",
"queryType": "randomWalk",
"refId": "A"
},
{
"exemplar": true,
"expr": "rate(node_disk_written_bytes_total{device!~\".*(zram|boot|dm-|mtdblock).*\"}[1m])",
"hide": false,
"interval": "",
"legendFormat": " write",
"queryType": "randomWalk",
"refId": "B"
},
{
"exemplar": true,
"expr": "- rate(node_disk_io_time_seconds_total{device!~\".*(zram|boot|dm-|mtdblock).*\"}[1m])",
"hide": false,
"interval": "",
"legendFormat": " load",
"refId": "C"
},
{
"exemplar": true,
"expr": "- rate(node_disk_written_bytes_total{device!~\".*(zram|boot|dm-|mtdblock).*\"}[1m])",
"hide": false,
"interval": "",
"legendFormat": " write ghost",
"queryType": "randomWalk",
"refId": "D"
},
{
"exemplar": true,
"expr": "rate(node_disk_read_bytes_total{device!~\".*(zram|boot|dm-|mtdblock).*\"}[1m])",
"hide": false,
"interval": "",
"legendFormat": " read ghost",
"queryType": "randomWalk",
"refId": "E"
}
],
"title": "Disk IO by Disk",
"transformations": [],
"type": "timeseries"
},
{
"aliasColors": {},
"bars": false,
"dashLength": 10,
"dashes": false,
"datasource": {
"type": "prometheus",
"uid": "P3791F55F620A72A5"
},
"fill": 1,
"fillGradient": 0,
"gridPos": {
"h": 8,
"w": 9,
"x": 15,
"y": 21
},
"hiddenSeries": false,
"id": 37,
"legend": {
"avg": false,
"current": false,
"max": false,
"min": false,
"show": true,
"total": false,
"values": false
},
"lines": true,
"linewidth": 1,
"nullPointMode": "null",
"options": {
"alertThreshold": true
},
"percentage": false,
"pluginVersion": "v1.0",
"pointradius": 2,
"points": false,
"renderer": "flot",
"seriesOverrides": [],
"spaceLength": 10,
"stack": false,
"steppedLine": false,
"targets": [
{
"exemplar": true,
"expr": "sum by (hostname) (rate(node_disk_read_bytes_total[1m]))",
"hide": false,
"interval": "",
"legendFormat": "disk read",
"refId": "C"
},
{
"exemplar": true,
"expr": "sum by (hostname) (rate(node_disk_written_bytes_total[1m]))",
"hide": false,
"interval": "",
"legendFormat": "disk write",
"refId": "D"
}
],
"thresholds": [],
"timeRegions": [],
"title": "Disk IO",
"tooltip": {
"shared": true,
"sort": 0,
"value_type": "individual"
},
"type": "graph",
"xaxis": {
"mode": "time",
"show": true,
"values": []
},
"yaxes": [
{
"$$hashKey": "object:37",
"format": "binbps",
"logBase": 1,
"show": true
},
{
"$$hashKey": "object:38",
"format": "binbps",
"logBase": 1,
"show": true
}
],
"yaxis": {
"align": true
}
},
{
"collapsed": true,
"datasource": {
"type": "datasource",
"uid": "grafana"
},
"gridPos": {
"h": 1,
"w": 24,
"x": 0,
"y": 29
},
"id": 34,
"panels": [
{
"datasource": {
"type": "prometheus",
"uid": "P3791F55F620A72A5"
},
"fieldConfig": {
"defaults": {
"color": {
"mode": "palette-classic"
},
"custom": {
"axisLabel": "",
"axisPlacement": "auto",
"barAlignment": 0,
"drawStyle": "line",
"fillOpacity": 0,
"gradientMode": "none",
"hideFrom": {
"legend": false,
"tooltip": false,
"viz": false
},
"lineInterpolation": "linear",
"lineWidth": 1,
"pointSize": 2,
"scaleDistribution": {
"type": "linear"
},
"showPoints": "auto",
"spanNulls": false,
"stacking": {
"group": "A",
"mode": "none"
},
"thresholdsStyle": {
"mode": "off"
}
},
"mappings": [],
"min": 0,
"thresholds": {
"mode": "absolute",
"steps": [
{
"color": "green"
}
]
},
"unit": "bytes"
},
"overrides": [
{
"matcher": {
"id": "byFrameRefID",
"options": "C"
},
"properties": [
{
"id": "color",
"value": {
"fixedColor": "dark-red",
"mode": "fixed"
}
},
{
"id": "custom.hideFrom",
"value": {
"legend": false,
"tooltip": true,
"viz": false
}
},
{
"id": "custom.lineStyle",
"value": {
"dash": [
10,
10
],
"fill": "dash"
}
}
]
},
{
"matcher": {
"id": "byFrameRefID",
"options": "B"
},
"properties": [
{
"id": "custom.hideFrom",
"value": {
"legend": false,
"tooltip": false,
"viz": true
}
}
]
}
]
},
"gridPos": {
"h": 7,
"w": 12,
"x": 0,
"y": 30
},
"id": 32,
"maxPerRow": 3,
"options": {
"legend": {
"calcs": [
"lastNotNull"
],
"displayMode": "table",
"placement": "right"
},
"tooltip": {
"mode": "single",
"sort": "none"
}
},
"repeat": "disks",
"repeatDirection": "v",
"targets": [
{
"exemplar": true,
"expr": "node_filesystem_size_bytes{device=\"/dev/${disks}\"} - node_filesystem_avail_bytes{device=\"/dev/${disks}\"}",
"hide": false,
"interval": "",
"legendFormat": " [used]",
"queryType": "randomWalk",
"refId": "A"
},
{
"exemplar": true,
"expr": "node_filesystem_avail_bytes{device=\"/dev/${disks}\"}",
"hide": false,
"interval": "",
"legendFormat": " [free]",
"queryType": "randomWalk",
"refId": "B"
},
{
"exemplar": true,
"expr": "node_filesystem_size_bytes{device=\"/dev/${disks}\"}",
"hide": false,
"interval": "",
"legendFormat": " [total]",
"queryType": "randomWalk",
"refId": "C"
}
],
"title": "Disk Space",
"transformations": [
{
"id": "renameByRegex",
"options": {
"regex": "^/dev/(mapper/)?",
"renamePattern": ""
}
}
],
"type": "timeseries"
},
{
"datasource": {
"type": "prometheus",
"uid": "P3791F55F620A72A5"
},
"description": "",
"fieldConfig": {
"defaults": {
"color": {
"mode": "palette-classic"
},
"custom": {
"axisLabel": "load (%) <-----> bytes (KiB/s)",
"axisPlacement": "auto",
"barAlignment": 0,
"drawStyle": "line",
"fillOpacity": 20,
"gradientMode": "none",
"hideFrom": {
"legend": false,
"tooltip": false,
"viz": false
},
"lineInterpolation": "linear",
"lineWidth": 1,
"pointSize": 5,
"scaleDistribution": {
"type": "linear"
},
"showPoints": "auto",
"spanNulls": false,
"stacking": {
"group": "A",
"mode": "none"
},
"thresholdsStyle": {
"mode": "off"
}
},
"mappings": [],
"thresholds": {
"mode": "absolute",
"steps": [
{
"color": "green"
},
{
"color": "red",
"value": 80
}
]
}
},
"overrides": [
{
"matcher": {
"id": "byFrameRefID",
"options": "C"
},
"properties": [
{
"id": "unit",
"value": "percentunit"
},
{
"id": "min",
"value": -1
},
{
"id": "max",
"value": 1
}
]
},
{
"matcher": {
"id": "byRegexp",
"options": "/.*(read|write)/"
},
"properties": [
{
"id": "unit",
"value": "binBps"
}
]
},
{
"matcher": {
"id": "byRegexp",
"options": "/.* ghost/"
},
"properties": [
{
"id": "custom.hideFrom",
"value": {
"legend": true,
"tooltip": true,
"viz": false
}
},
{
"id": "custom.lineWidth",
"value": 0
},
{
"id": "custom.showPoints",
"value": "never"
},
{
"id": "custom.fillOpacity",
"value": 0
}
]
}
]
},
"gridPos": {
"h": 7,
"w": 12,
"x": 12,
"y": 30
},
"id": 42,
"options": {
"legend": {
"calcs": [
"max"
],
"displayMode": "table",
"placement": "right"
},
"tooltip": {
"mode": "single",
"sort": "none"
}
},
"repeat": "disks",
"repeatDirection": "v",
"targets": [
{
"exemplar": true,
"expr": "rate(node_disk_read_bytes_total{device=~\"${disks}\"}[1m])",
"interval": "",
"legendFormat": " read",
"queryType": "randomWalk",
"refId": "A"
},
{
"exemplar": true,
"expr": "rate(node_disk_written_bytes_total{device=~\"${disks}\"}[1m])",
"hide": false,
"interval": "",
"legendFormat": " write",
"queryType": "randomWalk",
"refId": "B"
},
{
"exemplar": true,
"expr": "- rate(node_disk_io_time_seconds_total{device=~\"${disks}\"}[1m])",
"hide": false,
"interval": "",
"legendFormat": " load",
"refId": "C"
},
{
"exemplar": true,
"expr": "- rate(node_disk_written_bytes_total{device=~\"${disks}\"}[1m])",
"hide": false,
"interval": "",
"legendFormat": " write ghost",
"queryType": "randomWalk",
"refId": "D"
},
{
"exemplar": true,
"expr": "rate(node_disk_read_bytes_total{device=~\"${disks}\"}[1m])",
"hide": false,
"interval": "",
"legendFormat": " read ghost",
"queryType": "randomWalk",
"refId": "E"
}
],
"title": "IO/Usage",
"transformations": [],
"type": "timeseries"
}
],
"title": "Disks",
"type": "row"
}
],
"schemaVersion": 36,
"style": "dark",
"tags": [],
"templating": {
"list": [
{
"allValue": null,
"current": {
"selected": true,
"text": [],
"value": []
},
"datasource": {
"type": "prometheus",
"uid": "P3791F55F620A72A5"
},
"definition": "node_filesystem_size_bytes",
"hide": 0,
"includeAll": false,
"label": "Select Disks to display",
"multi": true,
"name": "disks",
"options": [],
"query": {
"query": "node_filesystem_size_bytes",
"refId": "StandardVariableQuery"
},
"refresh": 1,
"regex": "/device=\"\\/dev\\/(?!.*zram.*)([^\"]*)\".*(btrfs|ext4)/",
"skipUrlSync": false,
"sort": 0,
"type": "query"
},
{
"description": "Assumed maximum disk size in the metric for free disk space",
"hide": 2,
"label": "Assumed Maximum Disk Size",
"name": "max_disk_size_terrabytes",
"query": "-2147484000000",
"skipUrlSync": false,
"type": "constant"
}
]
},
"time": {
"from": "now-1h",
"to": "now"
},
"timepicker": {},
"timezone": "",
"title": "NCP",
"uid": "gmAYEfgnza",
"version": 2,
"weekStart": ""
}
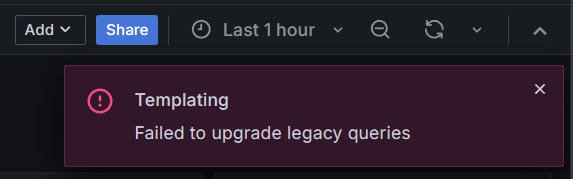
However, if the dashboard is imported directly, there will be a bunch of error, because the data source is missing.
Of course, you can do this way, and fix everything manually, but there is much better way. We just have to replace the ID of the data source in the json file.
-
Let us go to
Data sources>Prometheus. Note the ID in the address bar of the browser.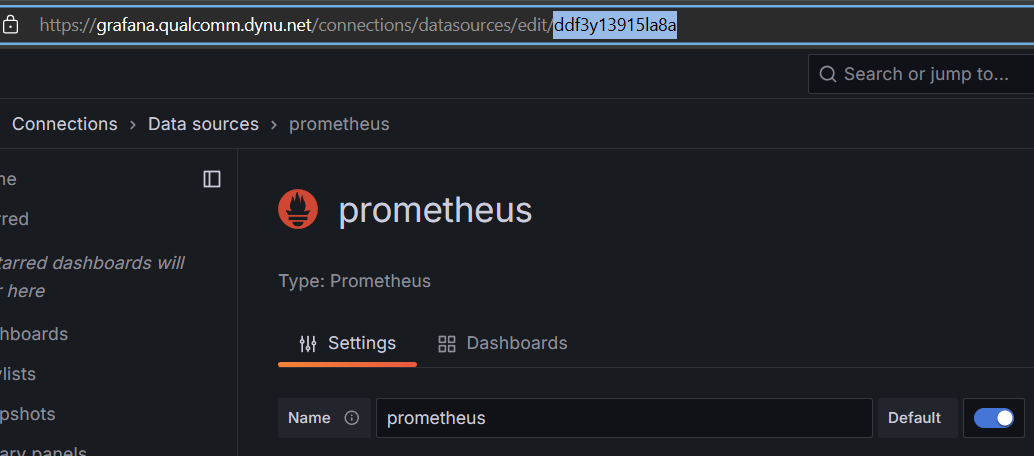
See the selected string? That is the UID of our Prometheus data source.
-
Globally replace the existing UID
P3791F55F620A72A5with our own’s. You can do this with any editor.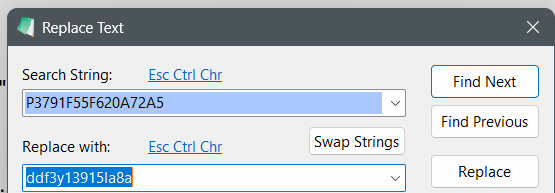
Do not use this “ddf3” one. Mine ID will not work for you, either.
-
There is one type of graph that is deprecated which can also be fixed here. Simply replace all occurrences of
"type": "graph"to any current type (“timeseries” is probably the closest one)"type": "timeseries".You can also fix this manually after the dashboard is imported, as there are only two occurrences.
-
Paste the modified json to Grafana. To do this, go to
Dashboards>New>Import. Now you should only see a warning, not errors. -
If you want to fix the warning about the deprecated
Angular pluginmanually, just simply switch the visualization type from legacyGraph(old)toTime seriesor other types that work for you.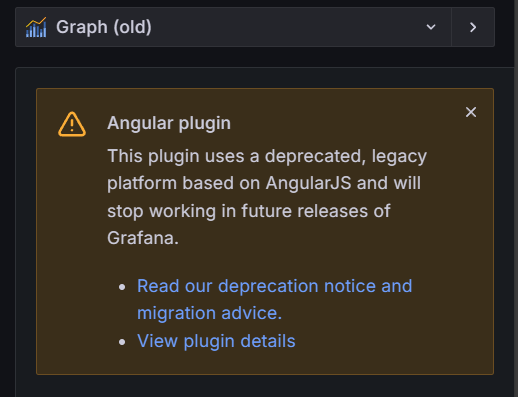
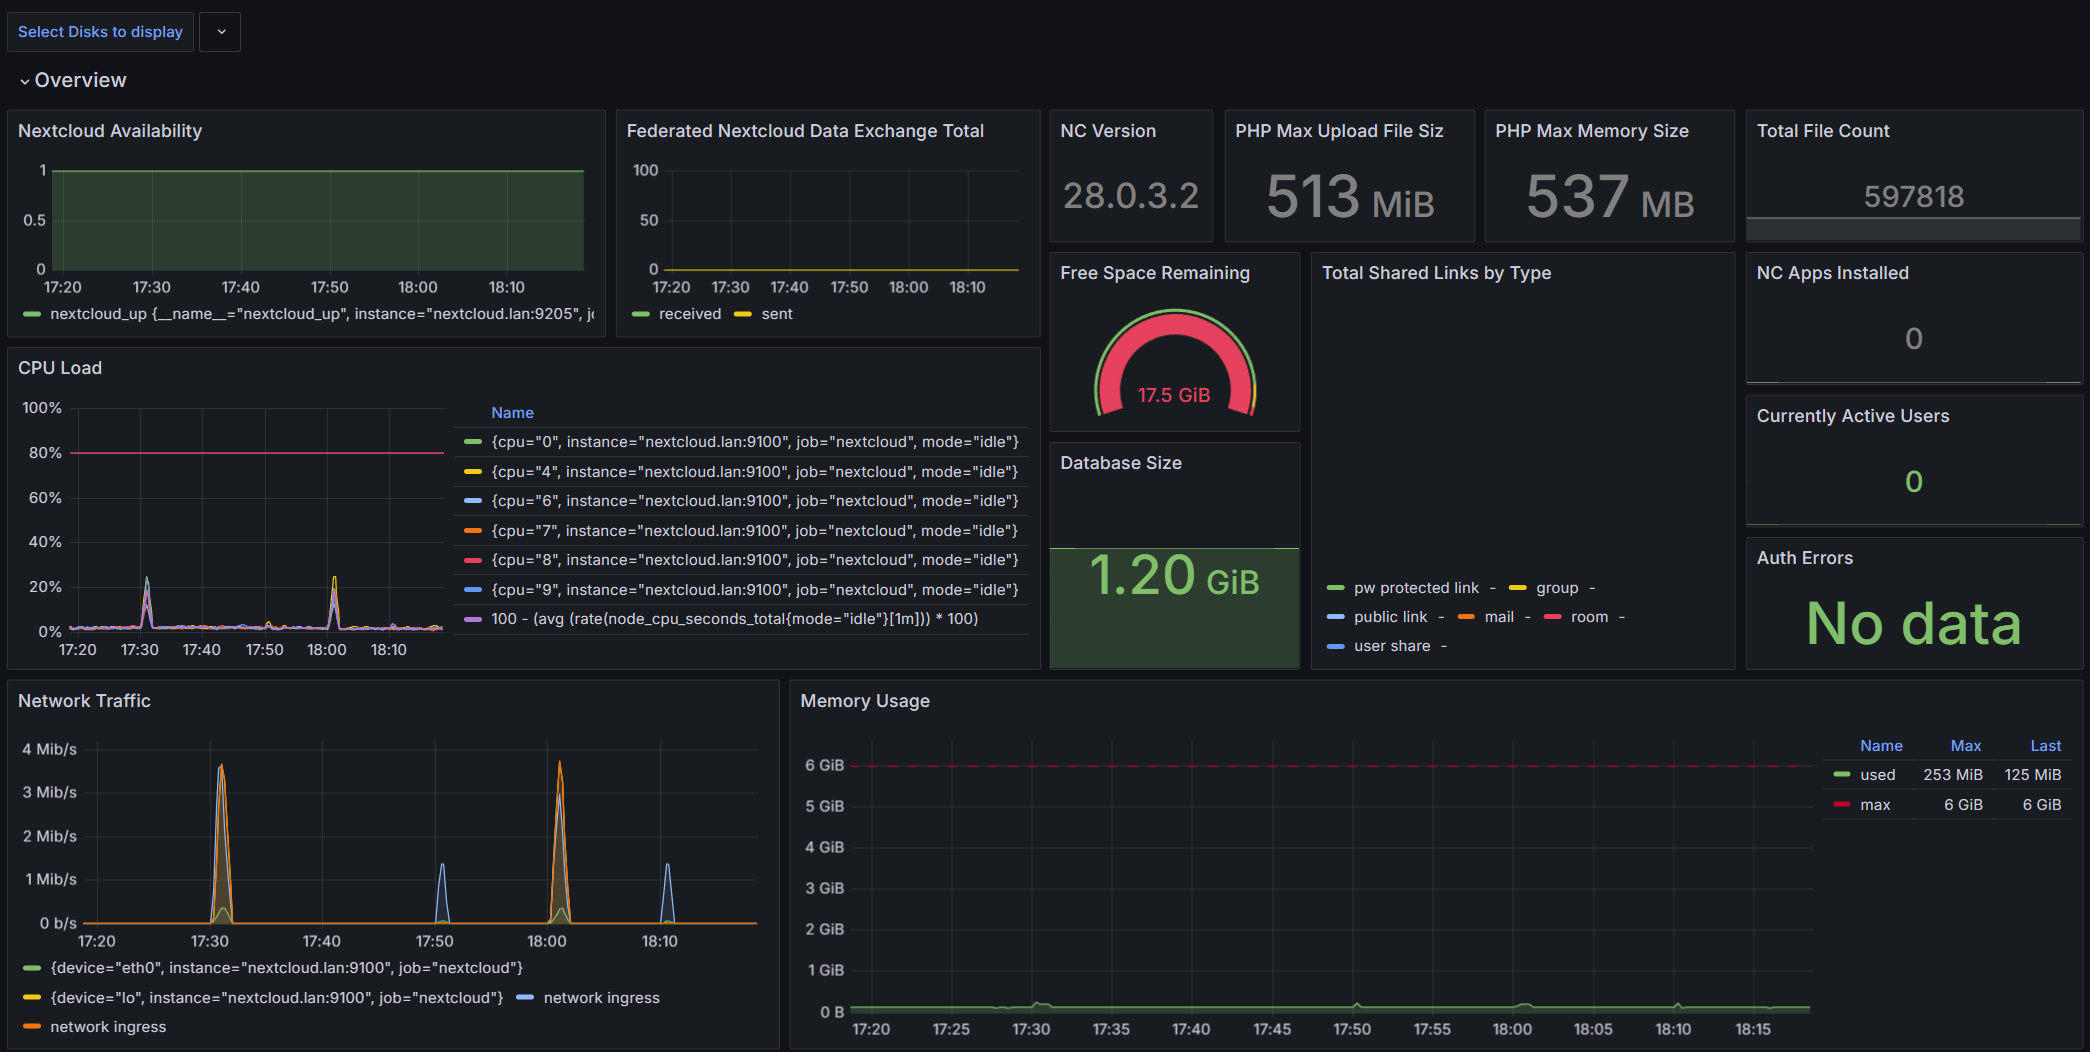
After this step, you should be able to see a dashboard nicely displayed.
You can start customizing the dashboard for your own needs from here, which should be much easier than starting from scratch.
If you unfortunately pasted the original json and want to fix it manually…
Take a look at the following section if really want to do it manually. However, my suggestion will be simply delete the dashboard and redo it with the way described above.
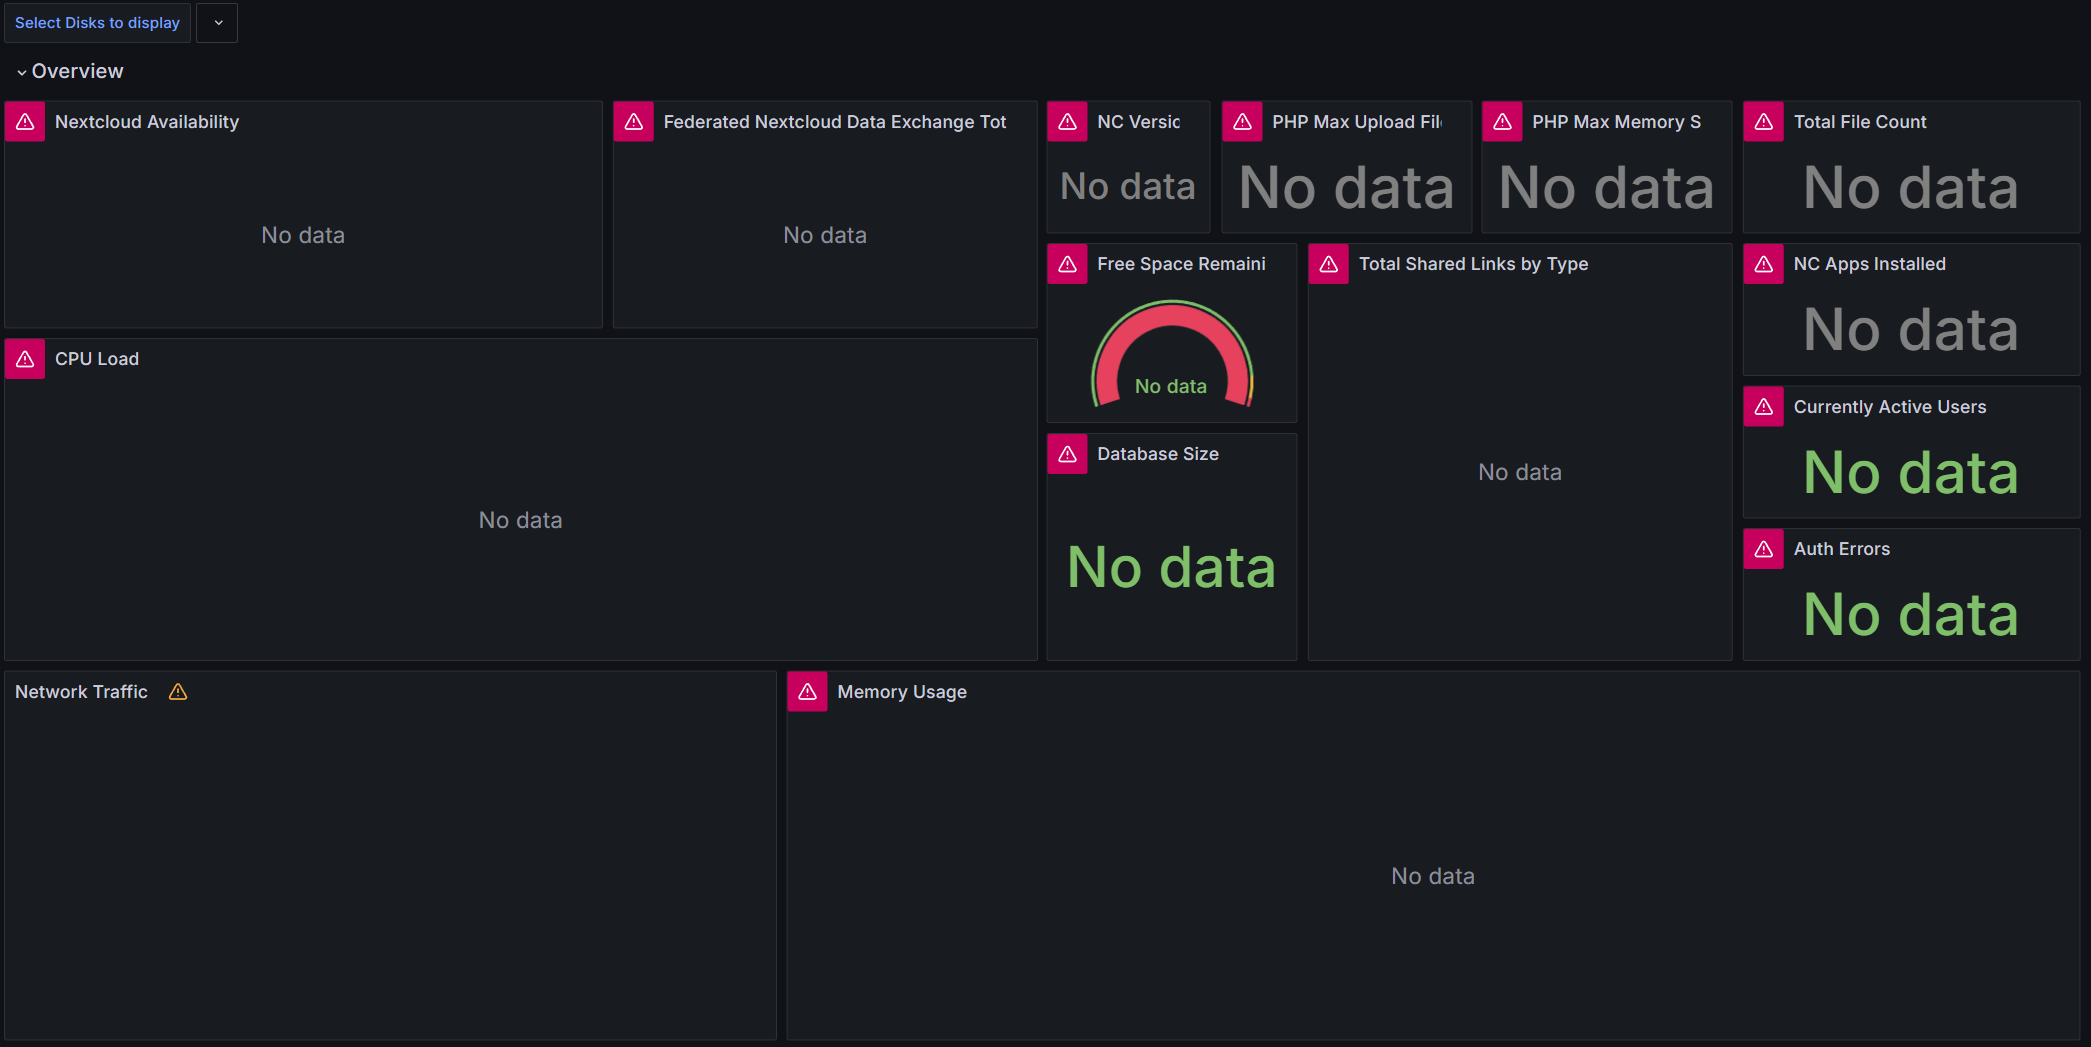
-
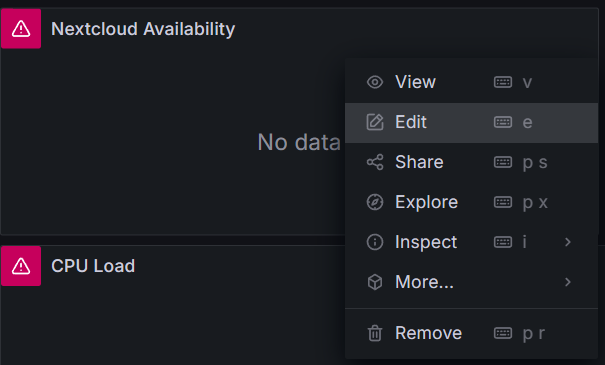
These red exclamation symbols are because of mismatching data source.
-
Go to a certain panel, and click “Edit”
-
Cut whatever exists in the
Metric browserbox, and paste it, then theRun queriesbutton will be clickable. Click the button and the data should be visualized. Save and apply, and repeat this for all dashboards. For dashboards with multiple queries, cutting and pasting for any one of them should be enough.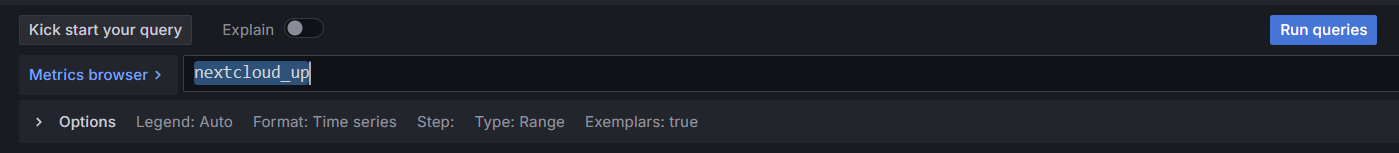
-
Once you have replaced all data sources, this error should be gone.
-
Fixing the “angular` deprecate warning is the same.
Home Lab Self-hosted Nextcloud Sysadmin Devops